
This paper estimates the effect of earnings per capita on adult obesity rates in 50 U.S. states from 2010-2020. Since the prevalence of obesity within populations is often associated with economic affluence, we seek to estimate the strength of the empirically observed relationship between a state’s earnings per capita and adult obesity rates. We take an OLS approach, incorporating both state and year fixed effects to measure the impact of earnings on obesity. Our setup also accounts for differences in earnings per state, which shows the effects that a difference in earnings has on obesity both on a state and regional level. Overall, we document that nationally when per capita personal income increases by $100, there is a 1.44% decrease in obesity rates controlling for state and year fixed effects. Our results illustrate that there is a statistically significant negative correlation between obesity and earnings.
Introduction
Obesity, defined as anyone with a body mass index (BMI) of 30 or higher, has become a major public health issue in the United States. With the persistent rise in obesity rates throughout the past four decades, roughly 40% of adults in the U.S. are currently overweight and over 2.8 million U.S. deaths per year are attributed to obesity . According to the CDC, in 2022, 19 states will have at least 35% of residents suffering from obesity, more than doubling the number of states with high obesity prevalence as measured in 2018 . In fact, obesity rates have varied widely from state to state, with states in the Midwest and the South demonstrating the highest obesity prevalence evident from Mississippi’s 40.8% and West Virginia’s 39.7% .
Due to obesity’s association with various medical complications alongside high health care expenditures, substantial effort has been devoted to identifying, financing, and enforcing reforms to combat this worsening epidemic. Rising obesity rates have been attributed to an amalgamation of different social and economic factors such as genetics, diet, physical activity, or race. However, in the past decade, inequality has been cited to allegedly increase obesity rates. Proponents of this link have provided mounting evidence such as social epidemiological research to demonstrate how obesity disproportionately affects the impoverished – as lower socioeconomic status restricts one’s access to healthcare and healthy foods – triggering health-related and psychosocial behaviors associated with high rates of obesity.
In this paper, we attempt to provide causal evidence of the effects of earnings per capita on adult obesity rates in the United States. We utilize statewide obesity data as well as individual level earnings data of the 50 states’ population to tackle this question as well as data spanning across 10 years (2010-2022). Per capita income is used as a measure of the standard of living of a population because it provides an average measure of income per person in a given population. This allows for comparison of the standard of living between different countries or regions, as well as within a country or region over time. Additionally, per capita income is a more reliable measure of the standard of living than other forms of income, such as household income, because it takes into account units at the individual level. This helps to account for differences in the size of the population and ensures that the measure is not skewed by large populations. It is also important to note that obesity rates show a large variation across different races, ethnicity, and ages. This variation highlights the need for targeted interventions and public health efforts to address obesity within these specific populations. However, fully addressing these would be beyond the scope of this paper.
Literature Review
This study adds to the growing literature surrounding the causal relationship between socioeconomic status and health. While there is an abundance of literature focusing on the putative contributors of the obesity epidemic such as technological innovation in food processing, increasingly sedentary work, and falling food prices, few research papers directly tackle the impact of income on obesity.
Our paper is tangentially related to the following three literatures. The first paper analyzes whether changes in income inequality can be considered a determinant of variations in body mass and obesity across the U.S. Using the Behavioral Risk Factor Surveillance (BRFSS) on state-level income inequality data based on tax payments, the study by Volland in 2012 identifies an independent effect of the state-level Gini coefficient on obesity rates and BMI in the U.S., with results suggesting that a 1% point increase in the state’s Gini coefficient increases average BMI by 0.014kg/m2 . Our paper complements Volland’s analysis by also focusing on how a state-level coefficient impacts obesity rates; however, instead of assessing a coefficient measuring income inequality, we look at an income coefficient – earnings per capita. The second paper, Gregory and Ruhm’s 2009 paper, examines the relationship between BMI and wages using semi-parametric wages and instrumental variables (IV). The results indicate that for women, earnings are reduced for those whose weight rises above a low threshold, and it is likely that the observation measures the effects of appearance or beauty often associated with lower levels of BMI, rather than obesity. On the other hand, predicted wages for men were maximized at a BMI of 26.7, but results provide little evidence of a sizable “obesity penalty” beyond the BMI of 30. Where this paper looks at specific BMI numbers and regresses that on wages, our paper will focus on the obesity rate of each of the 50 states, which is the percentage of the population with a BMI greater than 30 . The third paper by the Coronary Artery Risk Development in Young Adults Study in 2016 sought to determine whether sustained poverty is associated with changes in BMI, utilizing data from the years 1990-2015. Results indicated that poverty-stricken individuals were associated with greater BMI gain by 1.00 unit and 0.75 units among white men and women and less BMI gain by 2.0 units and 0.75 units among black men and women, respectively . While this paper supplements our study by examining the relationship between BMI and poverty, an indication of low income, our study will look at a more specific index – income per capita – and its relationship with obesity rates. Thus, by attempting to generate causal estimates of the effect of income per capita on obesity rates, our paper contributes to the ongoing discourse on the relationship between socioeconomic status and health, as well as to the literature examining the determinants of obesity rates.
Institutional Background and Data
The American diet has drastically shifted in the past century – slowly becoming embodied by an energy-dense, high fat, sugary diet. Notably, with the proliferation of sugar sweetened beverages (SSBs), the development of high-fructose corn syrup (HFCS), and the rise of fast food conglomerates selling highly-addicting products at a low price and at a convenient location, obesity rates have skyrocketed from 30.5% to 41.9% in the last twenty years (CDC). To make matters worse, advertisement agencies are specifically hired to produce the most enticing illustrations of food, targeted towards young audiences. The reason for this is because children are particularly susceptible to persuasive messages due to their limited cognitive development, and studies have shown 8-year-old children having “product preferences and perfect recall of content from the ads to which they have been exposed. ” Moreover, not all blame can be placed upon the food and beverage industry as individualistic habits can also have an outsized influence on body weight proportions. These factors are known as Social Determinants of Health (SDOH) – defined as “the conditions we live, learn, work and play in”(CDC). Within this characterization, the importance of physical activity cannot be overstated. Adults aged 18 to 60 will need “at least an hour a day of activity to counteract the effects of increasingly sedentary lifestyles.”9 However, only 23% of Americans are reaching this benchmark . Sleep has also been cited as a factor towards exacerbating obesity. On one hand, sleep deprivation increases calorie consumption from changes in appetite hormones, and on the other hand, sleep deprivation lowers energy expenditure due to fatigue. In addition, other often-cited but less common causes of obesity include pregnancy, smoking, medication-intake and genetics.
The federal government has a proven track record of combating the obesity epidemic at its root. From President Bush’s 2002 Healthier US initiative to First Lady Michelle Obama’s 2010 Let’s Move! campaign, candidates in the upper echelons of government have traditionally spearheaded well-funded and effective policy programs. Individual efforts aside, the FDA constantly reevaluates the nutrition labeling process, ensuring schools, restaurants and companies adhere to strict enforcement against misleading information. In fact, as part of the Patient Protection and Affordable Care Act in 2010, the FDA was granted authority to mandate ‘Calorie Counts’ on menu boards and nutrition labeling on Supplemental Nutrition Assistance Programs (SNAP). The latter of which has acted as a buffer to unemployment and family crises, and has shown to “reduce food insecurity by as much as 30 percent” . However, it is only through education and awareness that these initiatives can be well-advertised to the public. For example, the USDA’s “Team Nutrition” program allows students to differentiate between healthy and unhealthy foods, and the CDC’s choice of September as National Childhood Obesity month shows a commitment towards reducing obesity rates among youth. Another governmental assistance which is often overlooked is grants and financial assistance programs, such as the Massachusetts Food Trust Program that “increase access to local, healthy, and affordable food options to improve economic opportunities for nutritionally underserved communities”. Surprisingly, urban planning also has a crucial role in determining how active individuals are. The presence of parks, playgrounds, sidewalks and bike paths will encourage residents to undergo more physical activity. Additionally, zoning laws can also incentivize a range of food sources within food deserts. This underscores the importance of policy tools such as infrastructure budgeting and public transportation improvement projects to engrain the idea of an active lifestyle within Americans.
Data
Earnings Data – We draw our earnings dataset from the Bureau of Economic Analysis (BEA), a branch of the Department of Commerce founded by Richard Nixon in 1972. The BEA provides economic statistics such as GDP, personal income, and total employment that enable decision-makers, researchers, and the general American public to follow and understand the performance of the nation’s economy . In this study, we compile data on per capita adult income (aged 18 and up) on all fifty U.S. states from 2010-2020. The data reveals that adult per capita income in the U.S. has grown steadily from $40,459 in 2010 to $58,091 by 2020, a 43.58% increase.
Obesity Data – Within the same time period of 2010-2020, we collected data on the obesity rate per state by using annual reports from the Trust for America’s Health and The State of Childhood Obesity, a direct initiative of the Robert Wood Johnson Foundation (RWJF). To provide background information, RWJF is the largest healthcare-focused philanthropic organization located in Princeton, NJ that works to identify structural barriers to health and well-being, including racism, powerlessness, discrimination, and their consequences. Nonetheless, the obesity rate in this dataset is calculated using body mass index (BMI). BMI is a measure of body fat based on height and weight, and is calculated by dividing the weight in kilograms by the height in meters squared. The obesity rate was calculated by determining the percentage of adults in each state that have a BMI of 30 or more. Within this dataset, however, there is no data on the obesity rates for Delaware in 2014 and for New Jersey in 2019. These notable exceptions are important to note because their omission prevents our full understanding of the prevalence of obesity in each state and clouds decisions on how to best allocate resources and develop effective interventions.
It is safe to assume both data sources are credible. They not only provide statistics of obesity and earnings, but also data on national and international accounts that guide policy prescriptions on such key issues as economic growth, interindustry relationships, and the United States’ position in the world economy.
Empirical Approach
In order to estimate the effect of the income per capita on obesity rates in the 50 states, we adopt the following regression equation:
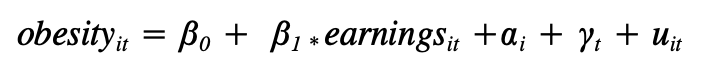
The variable ‘earnings’ is the average per capita personal income in the United States from 2010 to 2020. The variable ‘obesity’ is the outcome variable of interest which represents the obesity rate in the United States from 2010 to 2020. This is a panel data set observing United States residents for a 10 year period. In the equation, we will also include fixed effects on state (αi) and year (γt) variables to limit the omitted variable bias in our regression.
For our regression, we chose to utilize an ordinary least square regression. This is because a simple OLS regression of y on x can deliver an unbiased estimate of the causal effect of x on y. However, one of the biggest tasks in evaluating econometric evidence is deciding whether it is plausible that our estimator is unbiased and efficient, and precise. In this case, four key assumptions need to be made in order for the validity of OLS to withstand: linearity, random sampling, variation in x, and zero conditional mean. It is easy to deduce the legitimacy of the former three conditions; however, proving there is no correlation between the error term u and any of the right-hand side variables proves challenging. Namely, our study does not control for genetic factors such as gender, race, and heredity that have significant impact on obesity rates, creating omitted variable biases.
Thus, one of the ways to decrease omitted variable bias in this equation is to control for state and year fixed effects. By doing so, we can control for everything about ‘states’ that does not change over time and everything about ‘year’ that does not change over time, solely comparing changes over time in obesity with changes over time in earnings as a result. Moreover, both state and year fixed effects are large, overarching variables that take into account large sources of potential biases.
In the same vein, other potential biases that arise from the methodological context of the findings are due to endogeneity and reverse causation, where any association between obesity rates and earnings could be driven by obesity rates’ effect on earnings per capita. For example, annual medical expenditures for an obese person are on average 40% higher than for a non-obese persons, and an obese person misses 56% more work days compared to people with normal weight . Moreover, studies using implicit association tests have proven that hiring discrimination involved negative obesity stereotypes where managers are less likely to hire overweight job applicants. Thus, all this evidence points towards how high obesity rates could impact labor market outcomes and personal expenses, negatively affecting one’s income. And in the absence of controls for variables for the medical and labor market dimensions mentioned above, we might overestimate the adverse effects of income on obesity rates, rendering our OLS estimates biased and inconsistent. Comparison Between Other Techniques. In principle, it is difficult to estimate a causal effect using an OLS regression. For this reason, we turn to four causal inference estimation techniques in our toolkit but conclude with their inadequacies for our particular study. First, it is irresponsible to use RCT’s because it is almost impossible to randomize the treatment of ‘earnings’ across individuals in states, which would result in significant selection bias in our data. Secondly, in response to RD’s feasibility, there would not be a significant threshold which would act as a divider between treatment outcomes. Thirdly, diff-in-diff is void because it is financially and morally infeasible to compare changes over time between a control and treatment group of earnings. Lastly, instrumental variables wouldn’t have meaningful conclusions as too many variables affect earnings (challenging to correctly isolate good variation in the treatment variable). Thus, our study would lead to low relevance and exclusion levels.
Results (Shortened)
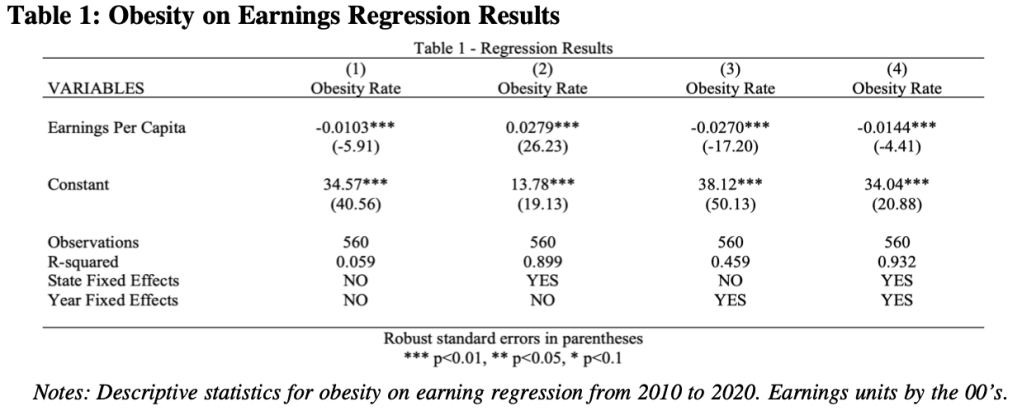
Table 1 shows the result of our regression of obesity on earnings for four different scenarios toggling state and year fixed effects. We should take interest in column 4 because it posits that an increase in earnings per capita by $100 per year decreases obesity rates by 1.44% holding constant state and year fixed effects. It is also important to note the regression in column 4 fits the data well evident with the squared value of 0.932, but this does not tell us anything regarding the quality of the model nor causal effects.
Conclusion
Overall, our study contributes to the existing literature on the relationship between earnings and obesity by providing causal evidence of the effects of earnings per capita on adult obesity rates in the United States. We conclude with a negative correlation between earnings per capita and adult obesity rates in the United States – illustrated by a 1.44% decrease in obesity rates per $100 increase in per capita personal income. This finding is consistent with the existing literature on the relationship between income and obesity, which has suggested that higher income may be associated with healthier behaviors and better access to healthy food and healthcare. However, it is important to note that earnings per capita can be misleading in some cases because it does not take into account certain factors that may affect the relationship between earnings and obesity rates.
In addition to our study, further research could be dedicated to examining the relationship between earnings and obesity within different racial groups. These findings will provide a more nuanced understanding of the challenges these groups face in terms of access to healthy foods and be valuable to policymakers seeking to address the obesity epidemic in the United States.
Below is my final paper submission for my class on Econometrics during the Fall 2022 school year at Tufts.
Work Cited
“About RWJF.” RWJF, December 5, 2022. https://www.rwjf.org/en/about-rwjf.html.
“Adult Obesity Facts.” Centers for Disease Control and Prevention. Centers for Disease Control and Prevention, May 17, 2022. https://www.cdc.gov/obesity/data/adult.html#:~:text=The%20obesity%20prevalence %20was%2039.8,adults%20aged%2060%20and%20older.
“Agricultural Grants and Financial Assistance Programs.” Mass.gov., https://www.mass.gov/guides/agricultural-grants-and-financial-assistance-programs.
“Census Profile: South Region.” Census Reporter, https://censusreporter.org/profiles/02000US1-northeast-region/.
“Census Profile: Northeast Region.” Census Reporter, https://censusreporter.org/profiles/https://censusreporter.org/profiles/02000US3-south- region/.
DeSilver, Drew. “For Most U.S. Workers, Real Wages Have Barely Budged in Decades.” Pew Research Center. Pew Research Center, May 30, 2020. https://www.pewresearch.org/fact-tank/2018/08/07/for-most-us-workers-real-wages-ha ve-barely-budged-for-decades/.
Ducharme, Jamie. “Only 23% of Americans Get Enough Exercise, a CDC Report Says.” Time. Time, June 28, 2018.
https://time.com/5324940/americans-exercise-physical-activity-guidelines/.
Elfassy, Tali, M Maria Glymour, Kiarri N Kershaw, Mercedes Carnethon, Maria M Llabre, Cora E Lewis, Neil Schneiderman, and Adina Zeki Al Hazzouri. “Association between Sustained Poverty and Changes in Body Mass Index, 1990-2015: The Coronary Artery Risk Development in Young Adults Study.” American journal of epidemiology. U.S. National Library of Medicine, June 1, 2018. https://www.ncbi.nlm.nih.gov/pmc/articles/PMC5982791/.
Farberman, Rhea, and Whitney Bright. “State of Obesity 2022: Better Policies for a Healthier America.” Trust for America’s Health., https://www.tfah.org/report-details/state-of-obesity-2022/.
“The Impact of Food Advertising on Childhood Obesity.” American Psychological Association. American Psychological Association, https://www.apa.org/topics/obesity/food-advertising-children.
12
Kim, Tae Jun, and Olaf von dem Knesebeck. “Income and Obesity: What Is the Direction of the Relationship? A Systematic Review and Meta-Analysis.” BMJ open. U.S. National Library of Medicine, January 5, 2018. https://www.ncbi.nlm.nih.gov/pmc/articles/PMC5781054/.
Kim, Tae Jun, and Olaf von dem Knesebeck. “Income and Obesity: What Is the Direction of the Relationship? A Systematic Review and Meta-Analysis.” BMJ open. U.S. National Library of Medicine, January 5, 2018. https://www.ncbi.nlm.nih.gov/pmc/articles/PMC5781054/.
“Most Obese States 2022.” World Population Review, https://worldpopulationreview.com/state-rankings/most-obese-states.
Novak, Nicole L, and Kelly D Brownell. “Role of Policy and Government in the Obesity Epidemic.” Aha Journals,
https://www.ahajournals.org/doi/10.1161/circulationaha.111.037929?cookieSet=1.
“Obesity in Mississippi.” University of Mississippi Medical Center, https://www.umc.edu/Research/Centers-and-Institutes/Centers/Mississippi-Center-for- Obesity-Research/Resources/Obesity_in_Mississippi.html.
“Physical Activity.” Obesity Prevention Source, April 12, 2016. https://www.hsph.harvard.edu/obesity-prevention-source/obesity-causes/physical-activit y-and-obesity/.
“Policy Basics: The Supplemental Nutrition Assistance Program (SNAP).” Center on Budget and Policy Priorities,
https://www.cbpp.org/research/food-assistance/the-supplemental-nutrition-assistance-pr ogram-snap.
Agerström, Jens & Rooth, Dan-Olof. (2011). The Role of Automatic Obesity Stereotypes in Real Hiring Discrimination. The Journal of Applied Psychology. 96. 790-805. 10.1037/a0021594.
Press Release. “Number of States with High Rates of Adult Obesity More than Doubles.” Centers for Disease Control and Prevention. Centers for Disease Control and Prevention, September 27, 2022. https://www.cdc.gov/media/releases/2022/p0927-states-obesity.html.
“Who We Are.” Who We Are | U.S. Bureau of Economic Analysis (BEA). https://www.bea.gov/about/who-we-are.

Leave a comment